The value of data
By Amanda Gibbins
Data is so important that the 2020 UN Report of the Secretary General ‘Roadmap for Digital Cooperation’ called amongst other things for global efforts to promote digital public goods such as open source software. The resultant uplift in technology and sharing of data will make a significant contribution to achieving the world’s Sustainable Development Goals.
An example of where this has become reality can be found in Project Maji. Based in Sub-Saharan Africa, Project Maji is using mWater’s open-source surveyor app and analytics platform to reach 278,000 people with improved water point access. To date they have provided over 200 solar-powered water access points in three countries, contributing to five of the Sustainable Development Goals, including Clean Water, Gender Equality, Quality Education, and Good Health and Well-being. You can read more about their work with mWater here.
At mWater we have seen how data can make a significant difference to both mundane and emergency situations. For example, DINEPA, Haiti’s water and sanitation agency, was able to respond with incredible effectiveness to the 2021 earthquake because they had mapped comprehensive data on the country’s water points. This data had been gathered prior to the earthquake, using their tailored water management system created by mWater. You can read more about Haiti’s earthquake response here.
In our line of work, data is ultimately all about people. It shows us how people are living their lives and the challenges they face. When analyzed the data shows the opportunities to create change, and indicates ways that lives can be improved.
The best data comes from people doing their jobs
Data collection is done most effectively when doing so is an easy and built-in part of people's day to day jobs. For example, data can be gathered on drinking water availability by people:
Responding to reports of a water leak
Carrying out routine water quality testing
Making sure water revenue is collected
Of course it can also be gathered through intentional mapping of water points, but this is still done most reliably and effectively when it’s made easy and routine for the enumerators.
Data collection before the digital revolution
Before the digital revolution, water, sanitation, and health data in developing countries was gathered very slowly. People would create paper maps of water sources and carry out paper surveys on their functionality. Health workers would also complete paper surveys, as they spoke to families about issues such as child weight gain, breastfeeding and vaccination schedules.
Huge amounts of data would be gathered, then compiled monthly by a supervisor into a report. These reports would then be fed back to the central government, sometimes as infrequently as annually.
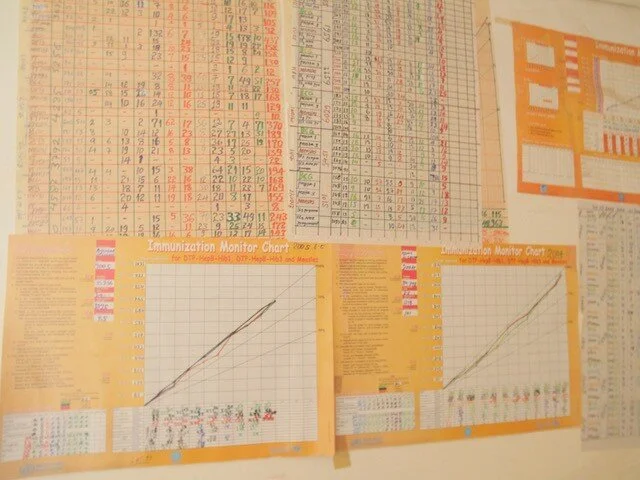
A government health office wall is filled with posters of compiled surveys on child health in Tigray, Ethiopia
The reason we say that paper is where data goes to die is because this information is often out of data before it is even compiled by a supervisor. It is certainly out of date by the time it reaches the central government, leaving little to no chance for decisions to be made in time to fend off any growing catastrophes such as drought or famine.
Data collection using mobile technology
The first advance that we offer at mWater and Solstice is to move from paper to digital data collection. Enumerators can use our surveyor app on their mobile phones to conduct surveys, which sync through the cloud with the data management portal.
Piles of paper on desks and walls covered in data charts become obsolete. Mobile data collection means that data is collected, collated, analyzed and responded to in real time!
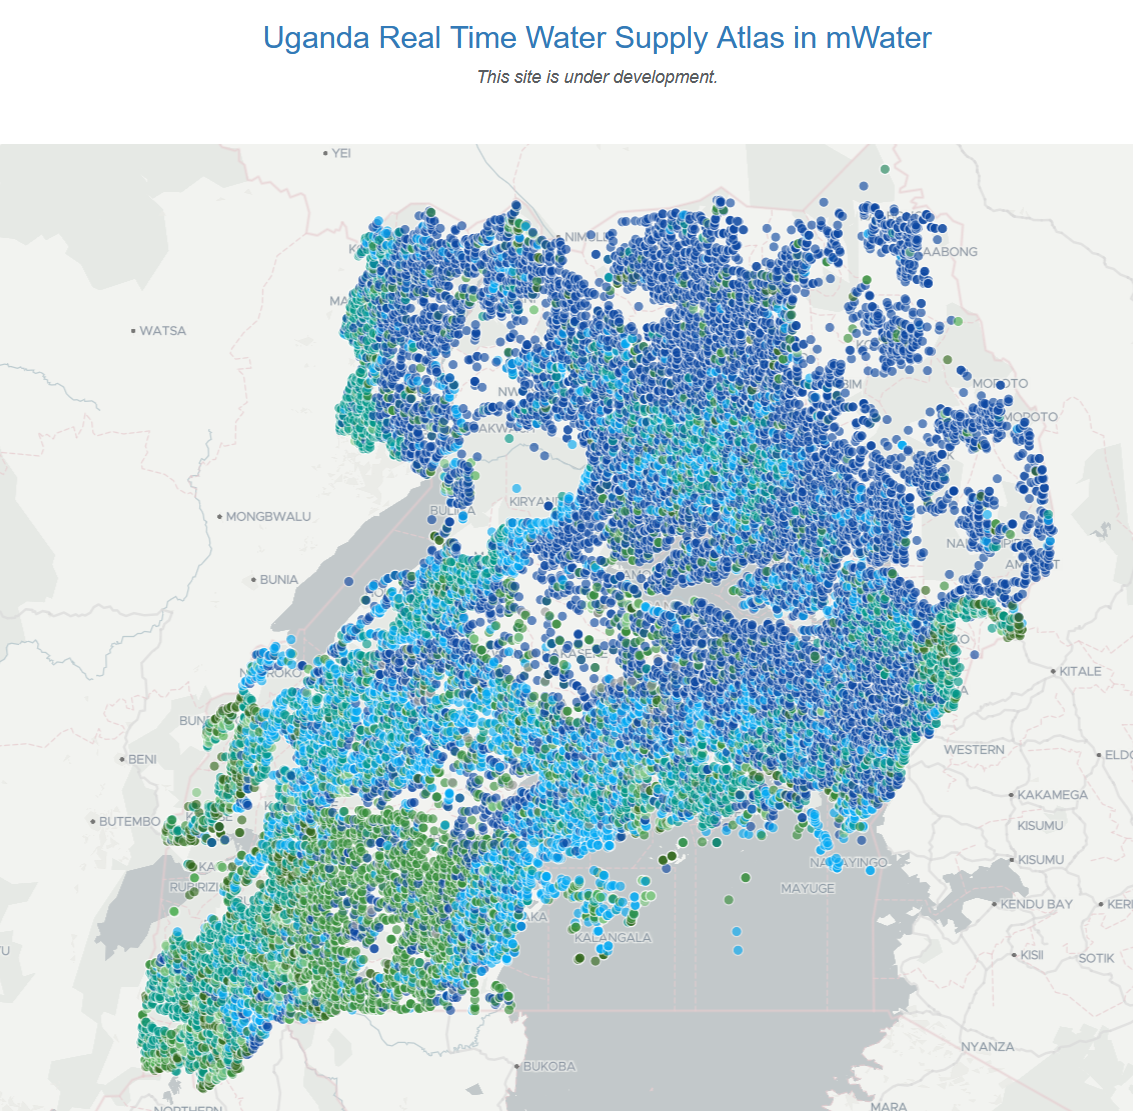
We also offer the ability to integrate data from spreadsheets such as Excel into our cloud-based platform. In Uganda, mWater built a tailored management information system for the Ugandan government, called RUMIS. Before RUMIS, the civil service was struggling with paper forms, manual data collection and updating fifteen different WASH databases. RUMIS has made data collection and analysis easier, and is enabling the Ugandan water department to bring about change and progress. To read more about this work, click here.
Digital data collection easily expands the kind of data that can be collected. For example, enumerators can upload photos of the water points surveyed onto the mWater platform, making it easier for engineers to identify a fault and take the right parts on the repair job. The GPS position of the water point can also be integrated into the data, making it easier to find.
Digital data collection also makes it possible for questions to be added to surveys as and when needed. Paper-based data collection moved so slowly as to make prompt response to impending disaster almost impossible. With digital collection, changes in behaviour and health can be spotted, and the survey updated to ask questions which will gather more data and give more detailed information.
Small data creates big images
The mWater system means that real-time data is gathered using our Surveyor app and then sent to the data analytics platform to be interpreted. With in-built data visualization, this ‘big data’ becomes much more understandable to those tasked with deciding responses to the data gathered. Mapping data onto digital maps also makes it possible to picture data results within the context of the setting. This inspires thoughts and conversation, and makes it easier for communities and governments to choose good plans for the future.
This was something also demonstrated in the emergency situation after the 2021 Haiti earthquake. With such a clear picture of the water points available, the emergency response was prompt, effective and remained under the control of the government at all times.

Taking data out of sector-specific silos
Aid is based in silos, but this has often led to missed opportunities for improving the lives of people that aid seeks to help.
If we can begin to de-silo data gathered for different purposes, this will help turn small data into even clearer images. We have created the Solstice Institute to support exactly this. For example, the World Health Organisation (WHO) has built a stand-alone interface on our Solstice platform for health facilities to easily measure indicators that integrate health and safe water. This will help improve all sorts of health outcomes for people using those clinics, including reduction of maternal mortality risks.
With real-time data also comes the ability to plan for the future. At mWater we are developing a planning tool, which will allow a government to look at the water point coverage for different towns and regions, and plan for how to improve this to SDG target levels.
At mWater we’re passionate about the uses of data in the pursuit of clean water and SDG 6.1.
You can read more about our work by following us on LinkedIn
https://www.linkedin.com/company/mwater/
and the Solstice Institute at