mWater Feature Updates 2022-2023
We’re constantly updating the features of mWater in response to user needs and as our scale grows. Here is a summary of the key updates from the past year.
See the video version here: https://www.youtube.com/watch?v=o-b-Sn0YLmw
Asset Management
Working with water systems?
Asset systems in mWater now allow you to freely map and track all of your water system assets anywhere in the world to the level of detail that works best for you, even down to each valve and tap. Having an accurate view of a system’s assets will then support your asset management processes.
New Navbar
We’ve updated our top navbar for clearer, faster navigation that also makes sites and asset features more prominent.

New Languages
You can always can translate your surveys to any language. But we’ve also added the following languages to the mWater Surveyor app so that the interface is now available in 24 languages. New languages added in 2022:
German
Italian
Japanese
Javanese
Luganda
Sundanese
New Question Types
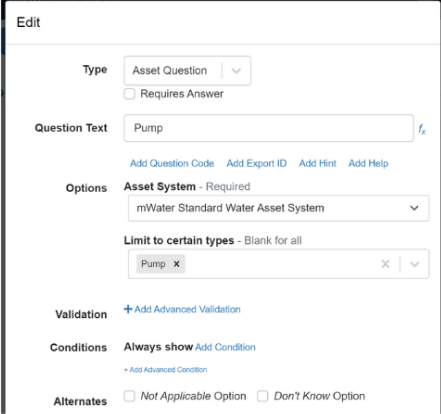
Asset Questions
Ranked Questions
We’ve added two new question types which you can add to any survey.
Asset questions allow you to link surveys to assets like valves, generators, tanks, pumps, pipes, etc.
Ranked questions allow you to have enumerators order responses in a ranking.
Survey Design Imports
You can now easily bring in survey designs from other platforms or from Excel and set them up in mWater. Just click Survey Design Import on the surveys page to begin. You can use simple Excel spreadsheets or use the standard XLSForms format to bring in more complex surveys.
See this guide for more information: https://portal.mwater.co/#/resource_center/importing_survey_designs

The Training Center
To learn the basics of the mWater App and Portal, you can complete modules in our Training Center at https://training.mwater.co. In addition to learning key skills, you can earn certificates upon successfully completing the modules.

Vector Maps
An overhaul of the mapping system in mWater onto vector maps allows for much faster maps at larger scale, with more precise zooming and even rotation.
Dataviz Updates
A number of enhancements have been made to data visualization and analysis in mWater too. Everything is based on the latest version of the underlying charting library, so should be faster and snappier. You can filter out blank values from pivot tables and charts, zooming in on only the data relevant in a given context and time. Regular tables now have frozen headers, and you can calculate totals (or other aggregates such as average values). You can also add colour rules to cells to highlight outliers.
Want to fund new features in mWater? Get in touch via info@mwater.co